Summarise, Print and Plot a Fitted Ratio Model
Source:R/backend_sghmc.R, R/backend_vi.R, R/tratio.R
summary.ratiod_fit.Rdprint() gives a short description of a fit: how it was inferred, the
family and the data. summary() returns the full report: posterior mean,
sd and credible interval of every main parameter with its convergence
diagnostics, which its print() method lays out. coef() returns the
posterior means of the fixed effects and vcov() their posterior
covariance; coef(summary(fit)) returns the summary table itself.
nobs() and formula() return the number of observations and the model
formula.
Usage
# S3 method for class 'ratiod_sghmc'
print(x, digits = 3, ...)

# S3 method for class 'ratiod_sgld'
print(x, digits = 3, ...)

# S3 method for class 'ratiod_vi'
print(x, digits = 3, ...)

# S3 method for class 'ratiod_vi'
summary(object, prob = 0.95, ...)

# S3 method for class 'summary.ratiod_vi'
print(x, digits = 3, ...)

# S3 method for class 'ratiod_fit'
print(x, ...)

# S3 method for class 'ratiod_fit'
summary(object, prob = 0.95, ...)

# S3 method for class 'summary.ratiod_fit'
print(x, ...)

# S3 method for class 'summary.ratiod_fit'
coef(object, ...)

# S3 method for class 'ratiod_fit'
coef(object, ...)

# S3 method for class 'ratiod_fit'
vcov(object, ...)

# S3 method for class 'ratiod_fit'
nobs(object, ...)

# S3 method for class 'ratiod_fit'
formula(x, ...)

# S3 method for class 'ratiod_fit'
plot(x, pars = NULL, type = c("trace", "dens", "both"), n_col = NULL, ...)
Arguments
- x
A fit returned by
tratio(): aratiod_fit, or one of the backend subclassesratiod_vi,ratiod_sghmcandratiod_sgld, or the summary of one.- digits
Number of significant digits to print (default 3).
- ...
Ignored
- object
A ratiod_fit object
- prob
Probability mass for credible intervals (default 0.95)
- pars
Character vector of parameter names to plot. If NULL (default), plots the first 12 main parameters (fixed effects, variance components).
- type
Type of plot: "trace" (default), "dens" (density), or "both".
- n_col
Number of columns in the plot grid (default: auto).
Value
An object of class summary.ratiod_vi.
The input x, invisibly.
summary(): a summary.ratiod_fit object. coef(): a named
vector, numerator coefficients prefixed num: and denominator ones
denom:. vcov(): the matching covariance matrix.
Invisibly returns the plot object (base graphics or ggplot2).
Examples
# Create simple dataset
set.seed(456)
n <- 48
site <- factor(rep(1:6, each = 8))
u <- rnorm(6, sd = 0.5)[site]
depth <- rnorm(n)
df <- data.frame(
count = rpois(n, exp(2 + 0.3 * depth + u)),
effort = rgamma(n, shape = 2, rate = 0.5 * exp(-u)),
depth = depth,
site = site
)
# \donttest{
fit <- tratio(
count | effort ~ depth + (1|site),
data = df,
family = ratiod_poisson_gamma(),
control = list(iter = 400, chains = 2, seed = 1)
)
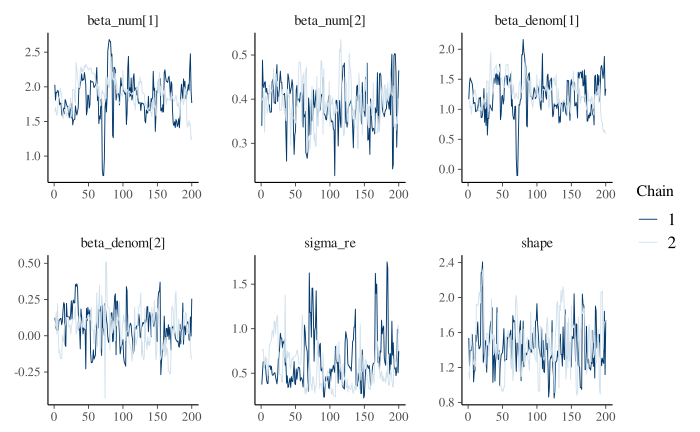
plot(fit)
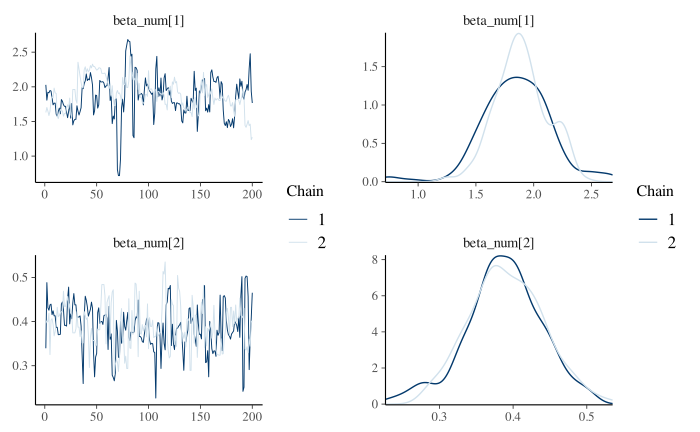
 plot(fit, pars = "beta_num", type = "both")
 # }
# }