Generate posterior predictive checks for a fitted ratio model. Compares observed data to replicated data from the posterior predictive distribution.
Arguments
- object
A
ratiod_fitobject- type
Type of check: "dens_overlay", "scatter", "intervals", "stat"
- component
Which component: "numerator", "denominator", or "both"
- stat
Function for "stat" type (default: mean)
- ndraws
Number of posterior draws to replicate (default: 50)
- ...
Additional arguments passed to bayesplot functions
Examples
# \donttest{
# Simulate data and fit model
set.seed(123)
n <- 50
df <- data.frame(
count = rnbinom(n, size = 5, mu = 15),
total = rnbinom(n, size = 8, mu = 100),
x = rnorm(n),
site = factor(rep(1:10, each = 5))
)
fit <- tratio(
count | total ~ x + (1 | site),
data = df,
family = ratiod_negbin_negbin(),
control = list(iter = 400, chains = 1, seed = 1)
)
# Density overlay of replicated against observed numerators
pp_check(fit, type = "dens_overlay")
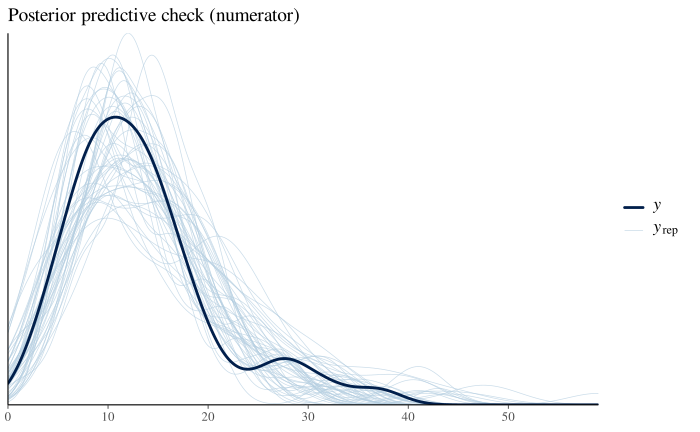 # }
# }