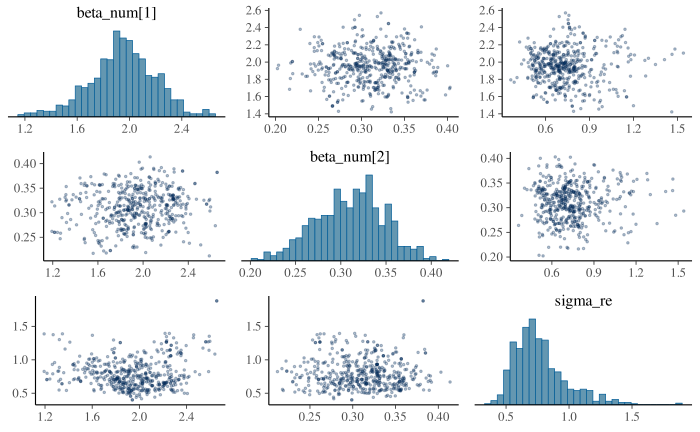
Creates a pairs plot showing bivariate relationships between parameters. Divergent transitions (if present) are highlighted to help identify problematic posterior regions.
Details
Pairs plots help identify:
Strong correlations between parameters (potential non-identifiability)
Multimodality
Regions where divergences cluster (indicating problematic geometry)
Examples
# \donttest{
sim <- sim_ratiod(n = 100, family = ratiod_poisson_gamma(), seed = 1)
fit <- tratio(y_num | y_denom ~ x1 + (1 | group), data = sim$data,
family = ratiod_poisson_gamma(),
control = list(iter = 1000, chains = 2, seed = 1))
plot_pairs(fit, pars = c("beta_num[1]", "beta_num[2]", "sigma_re"))
 # }
# }