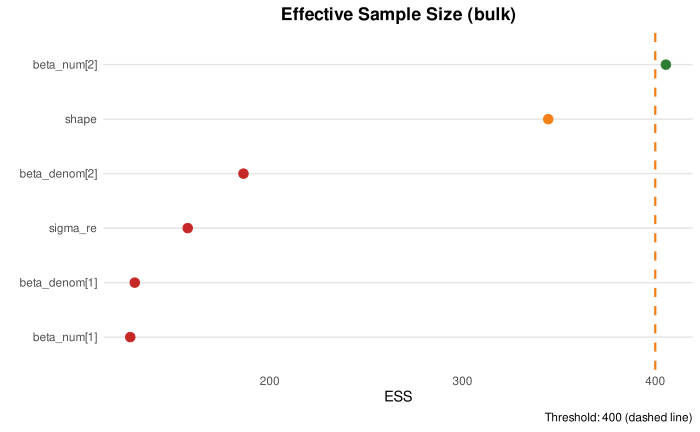
Creates a visual display of effective sample size (ESS) for all parameters, expressed as a ratio of ESS to total samples. Low ESS indicates high autocorrelation.
Usage
plot_ess(fit, type = c("bulk", "tail"), threshold = 400, pars = NULL)Details
ESS/iter ratio interpretation:
Green: ESS >= threshold
Yellow: threshold/2 <= ESS < threshold
Red: ESS < threshold/2
Examples
# \donttest{
sim <- sim_ratiod(n = 100, family = ratiod_poisson_gamma(), seed = 1)
fit <- tratio(y_num | y_denom ~ x1 + (1 | group), data = sim$data,
family = ratiod_poisson_gamma(),
control = list(iter = 1000, chains = 2, seed = 1))
plot_ess(fit)
 # }
# }