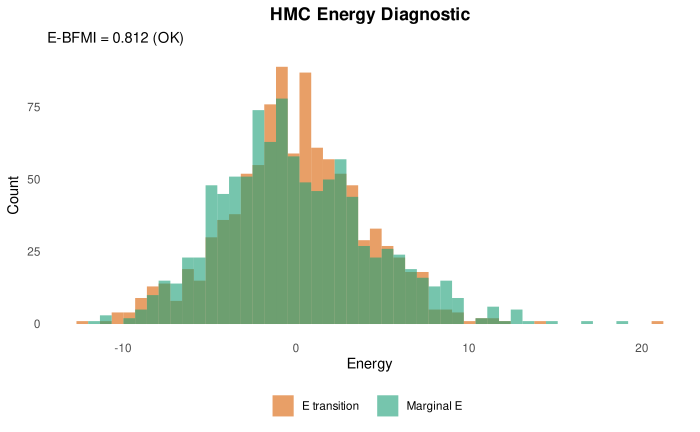
Creates overlaid histograms of marginal energy and energy transition, along with the E-BFMI statistic. Low E-BFMI indicates poor exploration of the posterior.
Details
E-BFMI (Energy Bayesian Fraction of Missing Information) compares the
distribution of energy levels to energy transitions. Values below 0.3
indicate the sampler may not be exploring the full posterior. The energy
is the Hamiltonian after each iteration's momentum draw; it is centred and
differenced within each chain, and the subtitle reports the lowest
per-chain E-BFMI (tulpa::energy_bfmi()).
Examples
# \donttest{
sim <- sim_ratiod(n = 100, family = ratiod_poisson_gamma(), seed = 1)
fit <- tratio(y_num | y_denom ~ x1 + (1 | group), data = sim$data,
family = ratiod_poisson_gamma(),
control = list(iter = 1000, chains = 2, seed = 1))
plot_energy(fit)
 # }
# }