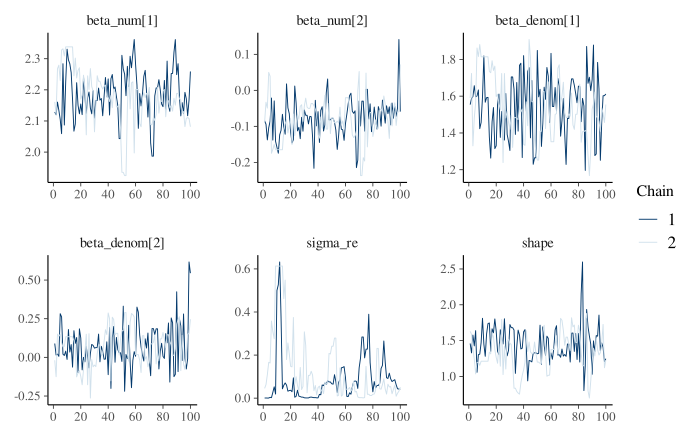
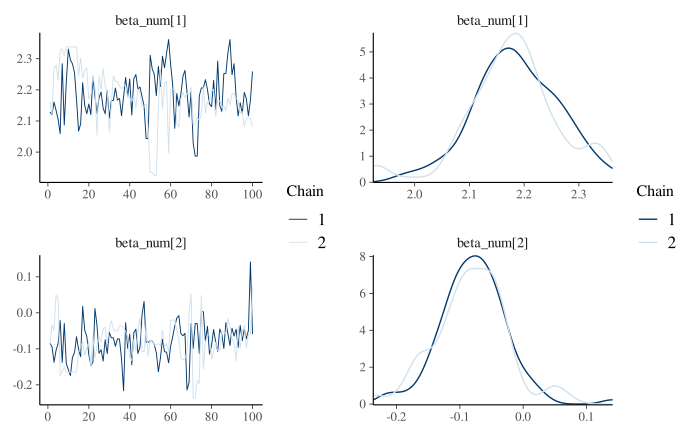
Creates diagnostic plots for ratio model fits including trace plots and optional density plots. Works with all backends (HMC, PG, Laplace).
Arguments
- x
A ratiod_fit object
- pars
Character vector of parameter names to plot. If NULL (default), plots main parameters (fixed effects, variance components).
- type
Type of plot: "trace" (default), "dens" (density), or "both".
- n_col
Number of columns in the plot grid (default: auto).
- ...
Additional arguments (currently ignored).
Examples
# Create simple dataset
set.seed(456)
df <- data.frame(
count = rpois(40, 8),
effort = rgamma(40, 2, 0.5),
depth = rnorm(40),
site = factor(sample(1:4, 40, replace = TRUE))
)
# \donttest{
fit <- tratio(
count | effort ~ depth + (1|site),
data = df,
family = ratiod_poisson_gamma(),
control = list(iter = 200, warmup = 100, chains = 2)
)
#> Inference: Exact (Tier 1)
#> Backend: hmc
#> Reason: default (full MCMC)
#> Fitting ratio model...
#> Family: poisson_gamma
#> Observations: 40
#> Iterations: 200 (warmup: 100)
#> Running NUTS sampler...
#> Parameters: 10
#> Iterations: 200 (warmup: 100)
#> Chains: 2 (cores: 2)
plot(fit)
 plot(fit, pars = "beta_num", type = "both")
 # }
# }